
Feature engineering
We hebben de data nu bekeken en hebben alle data die niet ok was verwijderd nu komen we aan een stap waar we met domain kennis gaan proberen om extra features te gaan aanmaken.
Het doel van feature engineering is om uw gegevens beter af te stemmen op het probleem.
Metingen van “schijnbare temperatuur”, zoals de hitte-index en de gevoelstemperatuur. Deze grootheden proberen de waargenomen temperatuur voor mensen te meten op basis van luchttemperatuur, vochtigheid en windsnelheid, dingen die we direct kunnen meten. Je zou een schijnbare temperatuur kunnen zien als het resultaat van een soort feature-engineering, een poging om de waargenomen gegevens relevanter te maken voor waar we echt om geven: hoe het werkelijk buiten aanvoelt!
Features combineren
We kunnen features wiskundig gaan combineren of features zelf onderwerpen aan een wiskundige operatie. Als we bijvoorbeeld ergens lengte hebben dan kunnen we opervlakte gaan berekenen om zo misschien toch lineaire relaties blood te leggen met de target variabele.
from pathlib import Path

# Installed packages
import pandas as pd
import numpy as np
from pandas_profiling.utils.cache import cache_file

# Read car dataset
file_name = cache_file(
    "cars.csv",
    "https://raw.githubusercontent.com/sanithps98/Automobile-Dataset-Analysis/master/module_5_auto.csv",
)
autos = pd.read_csv(file_name)
autos.head()
| Unnamed: 0 | Unnamed: 0.1 | symboling | normalized-losses | make | aspiration | num-of-doors | body-style | drive-wheels | engine-location | ... | compression-ratio | horsepower | peak-rpm | city-mpg | highway-mpg | price | city-L/100km | horsepower-binned | diesel | gas | |
|---|---|---|---|---|---|---|---|---|---|---|---|---|---|---|---|---|---|---|---|---|---|
| 0 | 0 | 0 | 3 | 122 | alfa-romero | std | two | convertible | rwd | front | ... | 9.0 | 111.0 | 5000.0 | 21 | 27 | 13495.0 | 11.190476 | Medium | 0 | 1 |
| 1 | 1 | 1 | 3 | 122 | alfa-romero | std | two | convertible | rwd | front | ... | 9.0 | 111.0 | 5000.0 | 21 | 27 | 16500.0 | 11.190476 | Medium | 0 | 1 |
| 2 | 2 | 2 | 1 | 122 | alfa-romero | std | two | hatchback | rwd | front | ... | 9.0 | 154.0 | 5000.0 | 19 | 26 | 16500.0 | 12.368421 | Medium | 0 | 1 |
| 3 | 3 | 3 | 2 | 164 | audi | std | four | sedan | fwd | front | ... | 10.0 | 102.0 | 5500.0 | 24 | 30 | 13950.0 | 9.791667 | Medium | 0 | 1 |
| 4 | 4 | 4 | 2 | 164 | audi | std | four | sedan | 4wd | front | ... | 8.0 | 115.0 | 5500.0 | 18 | 22 | 17450.0 | 13.055556 | Medium | 0 | 1 |
5 rows × 31 columns
autos["stroke_ratio"] = autos.stroke / autos.bore

autos[["stroke", "bore", "stroke_ratio"]].head()
| stroke | bore | stroke_ratio | |
|---|---|---|---|
| 0 | 2.68 | 3.47 | 0.772334 |
| 1 | 2.68 | 3.47 | 0.772334 |
| 2 | 3.47 | 2.68 | 1.294776 |
| 3 | 3.40 | 3.19 | 1.065831 |
| 4 | 3.40 | 3.19 | 1.065831 |
We kunnen zelfs verder gaan en gekende formules gaan toepassen. Vandaar dat hier domein kennis cruciaal zal zijn.
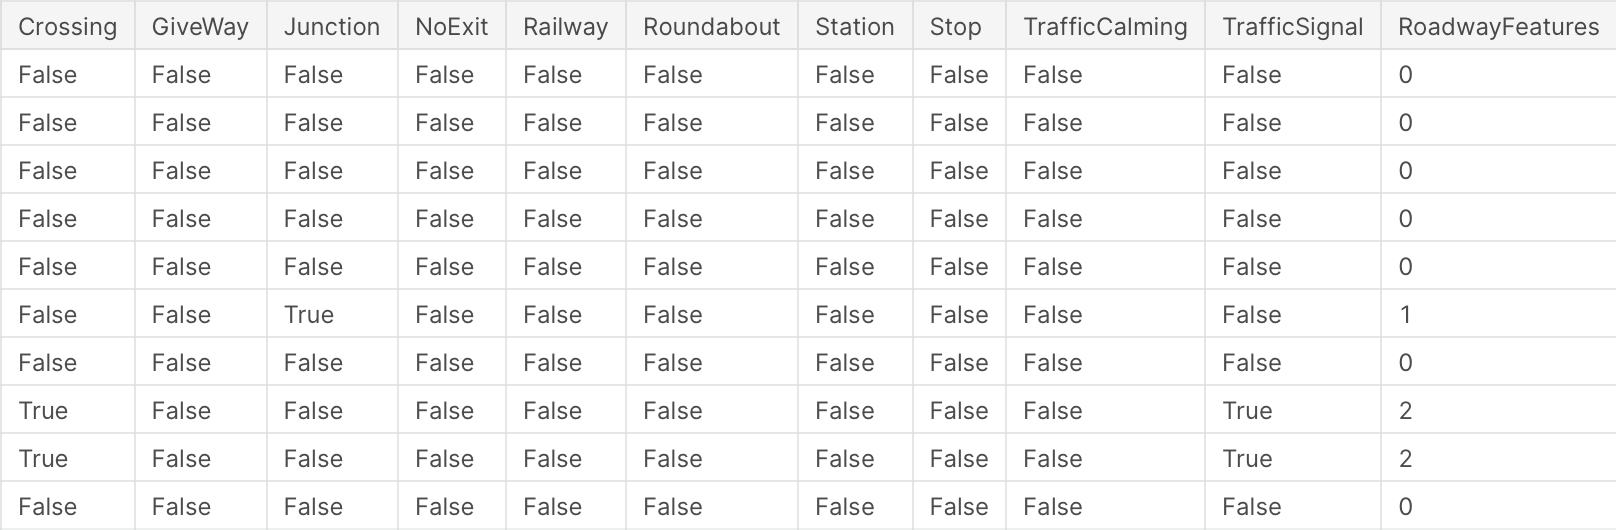
Tellen
We kunnen verschillende features met elkaar gaan combineren om tot een iets algemener feature te komen te komen.
roadway_features = ["Amenity", "Bump", "Crossing", "GiveWay",
    "Junction", "NoExit", "Railway", "Roundabout", "Station", "Stop",
    "TrafficCalming", "TrafficSignal"]
accidents["RoadwayFeatures"] = accidents[roadway_features].sum(axis=1)
Groeperen
We kunnen data per rij gaan groeperen en daar aggregaties op gaan toepassen.
Geospatial features
Bijvoorbeeld de gemiddelde verkoopwaarden van een huis binnen een regio kan zo een feature zijn.
Temporal features
Bijvoorbeeld aankoop transactie gaan groeperen per week en als kolom voorzien tijdstip-week.
# Standard Library Imports
from pathlib import Path

import pandas as pd
from pandas_profiling.utils.cache import cache_file

# Read the Titanic Dataset
file_name = cache_file(
    "titanic.csv",
    "https://raw.githubusercontent.com/datasciencedojo/datasets/master/titanic.csv",
)
titanic = pd.read_csv(file_name)

from pycaret.classification import *

clf1 = setup(titanic, target = 'Survived', silent=True, session_id=123, log_experiment=False, experiment_name='Survived')

X = get_config('X')
X
| Description | Value | |
|---|---|---|
| 0 | session_id | 123 |
| 1 | Target | Survived |
| 2 | Target Type | Binary |
| 3 | Label Encoded | 0: 0, 1: 1 |
| 4 | Original Data | (891, 12) |
| 5 | Missing Values | True |
| 6 | Numeric Features | 3 |
| 7 | Categorical Features | 8 |
| 8 | Ordinal Features | False |
| 9 | High Cardinality Features | False |
| 10 | High Cardinality Method | None |
| 11 | Transformed Train Set | (623, 712) |
| 12 | Transformed Test Set | (268, 712) |
| 13 | Shuffle Train-Test | True |
| 14 | Stratify Train-Test | False |
| 15 | Fold Generator | StratifiedKFold |
| 16 | Fold Number | 10 |
| 17 | CPU Jobs | -1 |
| 18 | Use GPU | False |
| 19 | Log Experiment | False |
| 20 | Experiment Name | Survived |
| 21 | USI | fdd0 |
| 22 | Imputation Type | simple |
| 23 | Iterative Imputation Iteration | None |
| 24 | Numeric Imputer | mean |
| 25 | Iterative Imputation Numeric Model | None |
| 26 | Categorical Imputer | constant |
| 27 | Iterative Imputation Categorical Model | None |
| 28 | Unknown Categoricals Handling | least_frequent |
| 29 | Normalize | False |
| 30 | Normalize Method | None |
| 31 | Transformation | False |
| 32 | Transformation Method | None |
| 33 | PCA | False |
| 34 | PCA Method | None |
| 35 | PCA Components | None |
| 36 | Ignore Low Variance | False |
| 37 | Combine Rare Levels | False |
| 38 | Rare Level Threshold | None |
| 39 | Numeric Binning | False |
| 40 | Remove Outliers | False |
| 41 | Outliers Threshold | None |
| 42 | Remove Multicollinearity | False |
| 43 | Multicollinearity Threshold | None |
| 44 | Remove Perfect Collinearity | True |
| 45 | Clustering | False |
| 46 | Clustering Iteration | None |
| 47 | Polynomial Features | False |
| 48 | Polynomial Degree | None |
| 49 | Trignometry Features | False |
| 50 | Polynomial Threshold | None |
| 51 | Group Features | False |
| 52 | Feature Selection | False |
| 53 | Feature Selection Method | classic |
| 54 | Features Selection Threshold | None |
| 55 | Feature Interaction | False |
| 56 | Feature Ratio | False |
| 57 | Interaction Threshold | None |
| 58 | Fix Imbalance | False |
| 59 | Fix Imbalance Method | SMOTE |
| Age | Fare | Pclass_1 | Pclass_2 | Pclass_3 | Name_Abbott Mr. Rossmore Edward | Name_Abelson Mr. Samuel | Name_Abelson Mrs. Samuel (Hannah Wizosky) | Name_Adahl Mr. Mauritz Nils Martin | Name_Adams Mr. John | ... | Cabin_E8 | Cabin_F E69 | Cabin_F33 | Cabin_F4 | Cabin_G6 | Cabin_T | Cabin_not_available | Embarked_C | Embarked_Q | Embarked_S | |
|---|---|---|---|---|---|---|---|---|---|---|---|---|---|---|---|---|---|---|---|---|---|
| 0 | 22.000000 | 7.250000 | 0.0 | 0.0 | 1.0 | 0.0 | 0.0 | 0.0 | 0.0 | 0.0 | ... | 0.0 | 0.0 | 0.0 | 0.0 | 0.0 | 0.0 | 1.0 | 0.0 | 0.0 | 1.0 |
| 1 | 38.000000 | 71.283302 | 1.0 | 0.0 | 0.0 | 0.0 | 0.0 | 0.0 | 0.0 | 0.0 | ... | 0.0 | 0.0 | 0.0 | 0.0 | 0.0 | 0.0 | 0.0 | 1.0 | 0.0 | 0.0 |
| 2 | 26.000000 | 7.925000 | 0.0 | 0.0 | 1.0 | 0.0 | 0.0 | 0.0 | 0.0 | 0.0 | ... | 0.0 | 0.0 | 0.0 | 0.0 | 0.0 | 0.0 | 1.0 | 0.0 | 0.0 | 1.0 |
| 3 | 35.000000 | 53.099998 | 1.0 | 0.0 | 0.0 | 0.0 | 0.0 | 0.0 | 0.0 | 0.0 | ... | 0.0 | 0.0 | 0.0 | 0.0 | 0.0 | 0.0 | 0.0 | 0.0 | 0.0 | 1.0 |
| 4 | 35.000000 | 8.050000 | 0.0 | 0.0 | 1.0 | 0.0 | 0.0 | 0.0 | 0.0 | 0.0 | ... | 0.0 | 0.0 | 0.0 | 0.0 | 0.0 | 0.0 | 1.0 | 0.0 | 0.0 | 1.0 |
| ... | ... | ... | ... | ... | ... | ... | ... | ... | ... | ... | ... | ... | ... | ... | ... | ... | ... | ... | ... | ... | ... |
| 886 | 27.000000 | 13.000000 | 0.0 | 1.0 | 0.0 | 0.0 | 0.0 | 0.0 | 0.0 | 0.0 | ... | 0.0 | 0.0 | 0.0 | 0.0 | 0.0 | 0.0 | 1.0 | 0.0 | 0.0 | 1.0 |
| 887 | 19.000000 | 30.000000 | 1.0 | 0.0 | 0.0 | 0.0 | 0.0 | 0.0 | 0.0 | 0.0 | ... | 0.0 | 0.0 | 0.0 | 0.0 | 0.0 | 0.0 | 0.0 | 0.0 | 0.0 | 1.0 |
| 888 | 29.885691 | 23.450001 | 0.0 | 0.0 | 1.0 | 0.0 | 0.0 | 0.0 | 0.0 | 0.0 | ... | 0.0 | 0.0 | 0.0 | 0.0 | 0.0 | 0.0 | 1.0 | 0.0 | 0.0 | 1.0 |
| 889 | 26.000000 | 30.000000 | 1.0 | 0.0 | 0.0 | 0.0 | 0.0 | 0.0 | 0.0 | 0.0 | ... | 0.0 | 0.0 | 0.0 | 0.0 | 0.0 | 0.0 | 0.0 | 1.0 | 0.0 | 0.0 |
| 890 | 32.000000 | 7.750000 | 0.0 | 0.0 | 1.0 | 0.0 | 0.0 | 0.0 | 0.0 | 0.0 | ... | 0.0 | 0.0 | 0.0 | 0.0 | 0.0 | 0.0 | 1.0 | 0.0 | 1.0 | 0.0 |
891 rows × 712 columns
titanic.drop(columns="Name",inplace=True)
clf1 = setup(titanic, target = 'Survived', silent=True, session_id=123, log_experiment=False, experiment_name='Survived', ordinal_features = {'Embarked' :['S', 'C', 'Q']})
X = get_config('X')
X
| Description | Value | |
|---|---|---|
| 0 | session_id | 123 |
| 1 | Target | Survived |
| 2 | Target Type | Binary |
| 3 | Label Encoded | 0: 0, 1: 1 |
| 4 | Original Data | (891, 11) |
| 5 | Missing Values | True |
| 6 | Numeric Features | 3 |
| 7 | Categorical Features | 7 |
| 8 | Ordinal Features | True |
| 9 | High Cardinality Features | False |
| 10 | High Cardinality Method | None |
| 11 | Transformed Train Set | (623, 566) |
| 12 | Transformed Test Set | (268, 566) |
| 13 | Shuffle Train-Test | True |
| 14 | Stratify Train-Test | False |
| 15 | Fold Generator | StratifiedKFold |
| 16 | Fold Number | 10 |
| 17 | CPU Jobs | -1 |
| 18 | Use GPU | False |
| 19 | Log Experiment | False |
| 20 | Experiment Name | Survived |
| 21 | USI | f8ef |
| 22 | Imputation Type | simple |
| 23 | Iterative Imputation Iteration | None |
| 24 | Numeric Imputer | mean |
| 25 | Iterative Imputation Numeric Model | None |
| 26 | Categorical Imputer | constant |
| 27 | Iterative Imputation Categorical Model | None |
| 28 | Unknown Categoricals Handling | least_frequent |
| 29 | Normalize | False |
| 30 | Normalize Method | None |
| 31 | Transformation | False |
| 32 | Transformation Method | None |
| 33 | PCA | False |
| 34 | PCA Method | None |
| 35 | PCA Components | None |
| 36 | Ignore Low Variance | False |
| 37 | Combine Rare Levels | False |
| 38 | Rare Level Threshold | None |
| 39 | Numeric Binning | False |
| 40 | Remove Outliers | False |
| 41 | Outliers Threshold | None |
| 42 | Remove Multicollinearity | False |
| 43 | Multicollinearity Threshold | None |
| 44 | Remove Perfect Collinearity | True |
| 45 | Clustering | False |
| 46 | Clustering Iteration | None |
| 47 | Polynomial Features | False |
| 48 | Polynomial Degree | None |
| 49 | Trignometry Features | False |
| 50 | Polynomial Threshold | None |
| 51 | Group Features | False |
| 52 | Feature Selection | False |
| 53 | Feature Selection Method | classic |
| 54 | Features Selection Threshold | None |
| 55 | Feature Interaction | False |
| 56 | Feature Ratio | False |
| 57 | Interaction Threshold | None |
| 58 | Fix Imbalance | False |
| 59 | Fix Imbalance Method | SMOTE |
| Age | Fare | Embarked | Pclass_1 | Pclass_2 | Pclass_3 | Sex_male | SibSp_0 | SibSp_1 | SibSp_2 | ... | Cabin_E49 | Cabin_E67 | Cabin_E68 | Cabin_E8 | Cabin_F E69 | Cabin_F2 | Cabin_F33 | Cabin_G6 | Cabin_T | Cabin_not_available | |
|---|---|---|---|---|---|---|---|---|---|---|---|---|---|---|---|---|---|---|---|---|---|
| 0 | 22.000000 | 7.250000 | 1.0 | 0.0 | 0.0 | 1.0 | 1.0 | 0.0 | 1.0 | 0.0 | ... | 0.0 | 0.0 | 0.0 | 0.0 | 0.0 | 0.0 | 0.0 | 0.0 | 0.0 | 1.0 |
| 1 | 38.000000 | 71.283302 | 2.0 | 1.0 | 0.0 | 0.0 | 0.0 | 0.0 | 1.0 | 0.0 | ... | 0.0 | 0.0 | 0.0 | 0.0 | 0.0 | 0.0 | 0.0 | 0.0 | 0.0 | 0.0 |
| 2 | 26.000000 | 7.925000 | 1.0 | 0.0 | 0.0 | 1.0 | 0.0 | 1.0 | 0.0 | 0.0 | ... | 0.0 | 0.0 | 0.0 | 0.0 | 0.0 | 0.0 | 0.0 | 0.0 | 0.0 | 1.0 |
| 3 | 35.000000 | 53.099998 | 1.0 | 1.0 | 0.0 | 0.0 | 0.0 | 0.0 | 1.0 | 0.0 | ... | 0.0 | 0.0 | 0.0 | 0.0 | 0.0 | 0.0 | 0.0 | 0.0 | 0.0 | 0.0 |
| 4 | 35.000000 | 8.050000 | 1.0 | 0.0 | 0.0 | 1.0 | 1.0 | 1.0 | 0.0 | 0.0 | ... | 0.0 | 0.0 | 0.0 | 0.0 | 0.0 | 0.0 | 0.0 | 0.0 | 0.0 | 1.0 |
| ... | ... | ... | ... | ... | ... | ... | ... | ... | ... | ... | ... | ... | ... | ... | ... | ... | ... | ... | ... | ... | ... |
| 886 | 27.000000 | 13.000000 | 1.0 | 0.0 | 1.0 | 0.0 | 1.0 | 1.0 | 0.0 | 0.0 | ... | 0.0 | 0.0 | 0.0 | 0.0 | 0.0 | 0.0 | 0.0 | 0.0 | 0.0 | 1.0 |
| 887 | 19.000000 | 30.000000 | 1.0 | 1.0 | 0.0 | 0.0 | 0.0 | 1.0 | 0.0 | 0.0 | ... | 0.0 | 0.0 | 0.0 | 0.0 | 0.0 | 0.0 | 0.0 | 0.0 | 0.0 | 0.0 |
| 888 | 29.885691 | 23.450001 | 1.0 | 0.0 | 0.0 | 1.0 | 0.0 | 0.0 | 1.0 | 0.0 | ... | 0.0 | 0.0 | 0.0 | 0.0 | 0.0 | 0.0 | 0.0 | 0.0 | 0.0 | 1.0 |
| 889 | 26.000000 | 30.000000 | 2.0 | 1.0 | 0.0 | 0.0 | 1.0 | 1.0 | 0.0 | 0.0 | ... | 0.0 | 0.0 | 0.0 | 0.0 | 0.0 | 0.0 | 0.0 | 0.0 | 0.0 | 0.0 |
| 890 | 32.000000 | 7.750000 | 3.0 | 0.0 | 0.0 | 1.0 | 1.0 | 1.0 | 0.0 | 0.0 | ... | 0.0 | 0.0 | 0.0 | 0.0 | 0.0 | 0.0 | 0.0 | 0.0 | 0.0 | 1.0 |
891 rows × 566 columns
(WIP) Dimension reduction
Met clustering is het mogelijk om features met elkaar te verbinden.